file:European Output of Books 500–1800.png

Page contents not supported in other languages.
Sabdkosh se

Original file(1,436 × 953 pixel, file ke size: 64 KB, MIME type: image/png)

Ii file Wikimedia Commons se aais hai aur duusra projects me bhi kaam me lawa jaae sake hai. Iske baare me aur jaankari file description page ke niche dekhawa jaae hai.

Sanchhipt me

Baare me
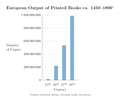
Deutsch: Geschätzte europäische Buchproduktion von 500 bis 1800. Bei den Manuskripten sind einzelne Urkunden und Chartas nicht berücksichtigt. Ein gedrucktes Buch ist definiert als ein Druckwerk von mehr als 49 Seiten.
English: Estimated European output of books from 500 to 1800. Manuscripts do not include individual deeds and charters. A printed book is defined as printed matter containing more than 49 pages.
Taarik
Source

Aapan kaam

Data from: Buringh, Eltjo; van Zanden, Jan Luiten: "Charting the “Rise of the West”: Manuscripts and Printed Books in Europe, A Long-Term Perspective from the Sixth through Eighteenth Centuries", The Journal of Economic History, Vol. 69, No. 2 (2009), pp. 409–445 (416–417, tables 1&2)
Likhe waala Tentotwo
Other versions
This graph image could be re-created using vector graphics as an SVG file. This has several advantages; see Commons:Media for cleanup for more information. If an SVG form of this image is available, please upload it and afterwards replace this template with {{vector version available|new image name}}.


It is recommended to name the SVG file “European Output of Books 500–1800.svg”—then the template Vector version available (or Vva) does not need the new image name parameter.

LaTeX source

\documentclass[border=5mm]{standalone}
\usepackage{pgfplots}
\usepackage[super]{nth}
\usepackage{amsmath}
 
 
\pgfplotstableread{
Siglos Manuscritos Libros impresos
6       13552           nan
7       10639           nan
8       43702           nan
9       201742  nan
10      135637  nan
11      212030  nan
12      768721  nan
13      1761951 nan
14      2746951 nan
%15   4999161 12589000
16       nan            217444000
17      nan             531941000
18      nan             983874000
}\datatable
 
\definecolor{RYB1}{RGB}{128, 177, 211}
\definecolor{RYB2}{RGB}{253, 180, 98}
 
\begin{document}
\begin{tikzpicture}
\begin{semilogyaxis}[
        axis on top=false, grid=both, xmajorgrids=false, every minor grid/.style=gray!20,
        axis lines*=left,
        width=12cm, height=8cm, enlarge x limits=0.05,
        ymin=1000, ymax=1e9,ytick={1000,1e4, 1e5, 1e6, 1e7, 1e8, 1e9},
        yticklabels={1000, 10\,000, 100\,000, 1\,000\,000, 10\,000\,000, 100\,000\,000, 1\,000\,000\,000},
        enlarge y limits=false,
        ybar=-10pt, xtick={6,...,18}, xticklabel={\pgfmathparse{int(\tick)}\nth{\pgfmathresult}},
        xlabel=Siglos, xlabel style={yshift=-1ex},ylabel=Número\\ de Copias,
        ylabel style={rotate=-90, align=left, anchor=east, xshift=-4ex, name=ylabel},
        after end axis/.code={
                \node [
                        font=\large\bfseries,
                        text=RYB2!60!black, fill=white, fill opacity=0.85, text opacity=1,
                        anchor=center, inner xsep=1pt]  at (axis cs:11,5e3) {Manuscritos};
                \node [
                        font=\large\bfseries, inner xsep=1pt,
                        text=RYB1!60!black,
                        fill=white, fill opacity=0.85, text opacity=1,
                        align=center, anchor=center]  at (axis cs:16.6,5e3) {Libros impresos};\
        },
        title={Producción Europea occidental de libros entre los años 500 y 1800$^{\text{\tiny{*}}}$},
        title style={font=\large\bfseries, align=center}
        ]
 
        \addplot +[fill=RYB1, draw=RYB1!50!black] table [y=Books] {\datatable};
        \addplot +[fill=RYB1, draw=RYB1!50!black, /pgf/bar shift=2.5pt] coordinates {(15,12589000)};
        \addplot +[fill=RYB2, draw=RYB2!50!black] table {\datatable};
        \addplot +[fill=RYB2, draw=RYB2!50!black, /pgf/bar shift=-2.5pt] coordinates {(15,4999161)};
        \draw (rel axis cs:0,0) -- (rel axis cs:1,0);                 
\end{semilogyaxis}
\node (annotation) at (current axis.below south west) [inner xsep=0pt, anchor=north west, align=left, font=\tiny] {$^*$without Southeast Europe (Byzantine, later Ottoman realm) and Russia};
 
\end{tikzpicture}
\end{document}

Licence ke baare me

I, the copyright holder of this work, hereby publish it under the following license:
w:en:Creative Commons
attribution share alike
ii file ke Creative Commons Attribution-Share Alike 3.0 Unported license ke niche licence karaa gais hai.
You are free:
  • share kare ke khaatir – to copy, distribute and transmit the work
  • to remix – to adapt the work
II condition ke niiche:
  • attribution – Aap ke thiik credit de ke chaahi, licence pe jorr de ke chaahi, aur badlao ke dekhae ke chaahi. Aap iske koi reasonable manner me kare saktaa hai lekin aise nai ki lage ki licensor aap ke, nai to aap ke kaam ke endorse kre hai
  • share alike – Agar aap milaata hai, badaltaa hai, nai to material pe jorrtaa hai, tab aap ke aapan yogdaan ke same or compatible license ke niche baate kare kae chaaahi.

Captions

Add a one-line explanation of what this file represents

Items portrayed in this file

depicts English

copyrighted English

inception English

15 Disambar 2011

File ke itihaas

File ke dekhe khatir, jaise uu time dekhe me lagat rahaa, date/time pe click karo.

Din/TimeChhota chapaLambai aur chauraiSadasyaTiprrin
abhi waala14:41, 22 Disambar 201114:41, 22 Disambar 2011 waala version ke chhota chapa1,436 × 953 (64 KB)TentotwoRemoved source text from image
15:53, 16 Disambar 201115:53, 16 Disambar 2011 waala version ke chhota chapa1,455 × 953 (73 KB)TentotwoImproved formatting
12:38, 15 Disambar 201112:38, 15 Disambar 2011 waala version ke chhota chapa1,260 × 799 (87 KB)Tentotwo

Ii file ke koi panna kaam me nai laae hai.

Global file usage

Ii aur duusra wiki ii file ke use kare hai: